Illustrations for EL software
Example of fultration by set of band pass filters
Computing of backazimuts by beamforming
Computing of backazimuts by time shifts
Polarization analysis by 3C station
Selection from built-in data base
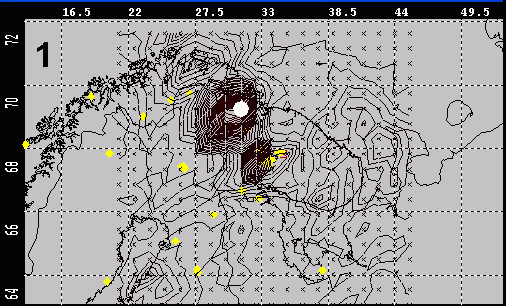
Stages of automatic location of seismic event (Zapolyarny mining explosion) with adaptive modification of grid shape.
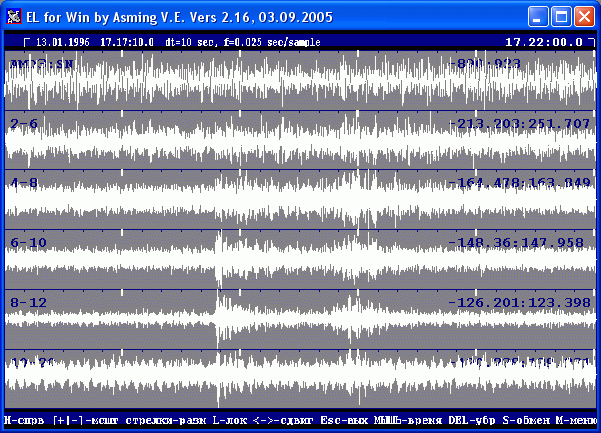
Filtration by set of band pass filters. Source signal (top) was filtered in bands 2-6, 4-8, 6-10, 8-12, 10-20 Hz. This enabled to find a seismic event in 4-12 Hz band.
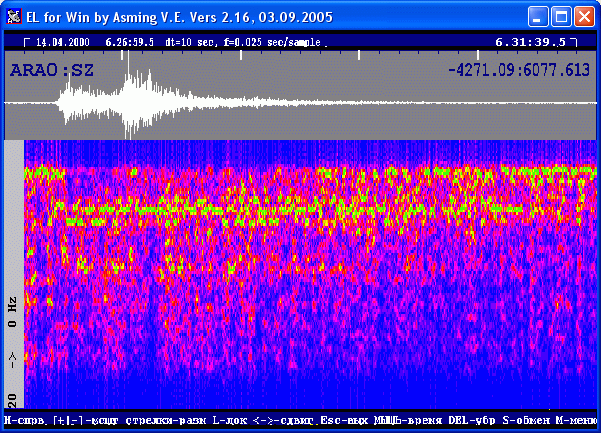
Plot of a sonogram (spectral-time diagram) of signal in range 0-20 Hz.
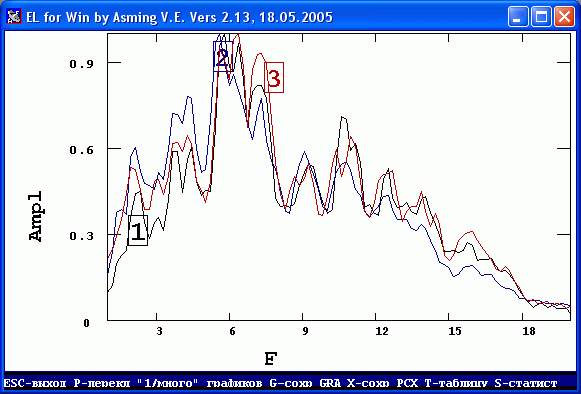
Plot of spectra.
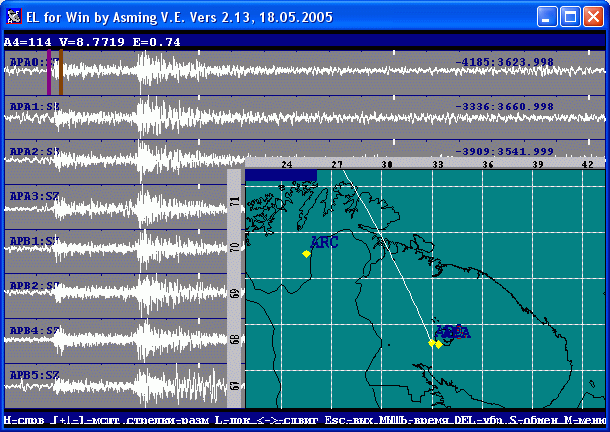
Computing array backazimuth by beamforming. The part of recording is marked which is used for the beamforming. The backazimuth was automatically plotted on the map, top screen line contains values of the backazimuth and apparent velocity.
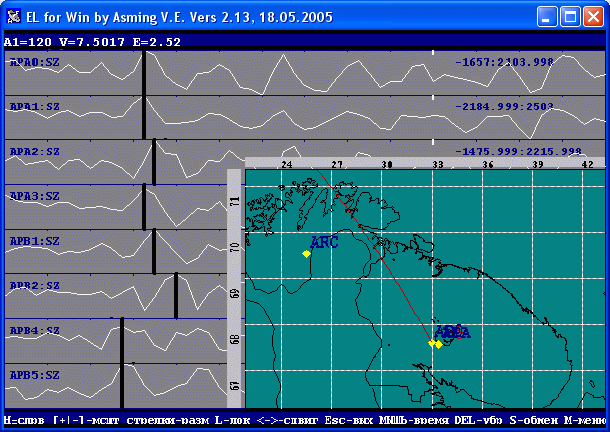
Computing array backazimuth by time shifts between channels. Each channel has a mark of signal arrival time. The backazimuth was automatically plotted on the map, top screen line contains values of the backazimuth and apparent velocity.

Polarization by 3C stations.
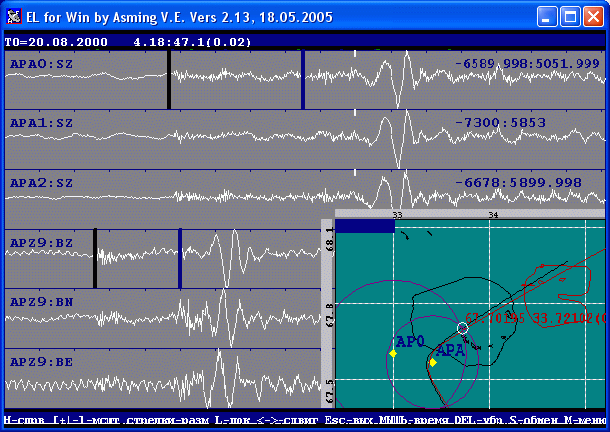
Location by arc method. Khibiny explosion is located by recordings of APA (Apatity) and AP0 (Apatity array). P and S onsets are marked on the recordings. P-S lines and P-P lines are plotted on the map. Their cross-section gives place of seismic event.
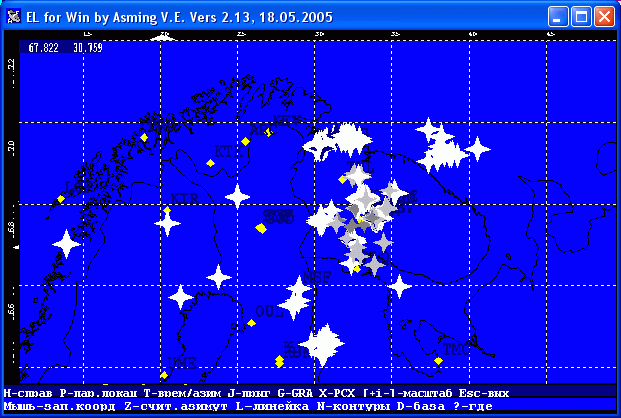
Built-in data base illustration. A selection was made from the base: 2000 year events were plotted on the map. For each of plotted events it is easy to look throug wave forms.