Asming V.E., Kremenetskaya E.O.
Study of applicability of P/S ratio criterion for
discrimination of regional earthquakes and explosions in North-Western area.
1. Introduction
In this study we consider the possibility of using P/S amplitudes ratio
for earthquake-explosion discrimination.
A measured P/S ratio obviously may depend on : kind of the source, its
radiation pattern, difference in P and S waves attenuation during their
propagation from the source to sensors, difference in P/S ratios caused by
local features of the medium near sensors.
We are making an attempt to separate all the factors and study their
influence on P/S ratio.
To clearify the possibility to use P/S ratios for discrimination (which
seems unclear and doubtful for the authors) we shall try to answer the
following questions :
1.1. What is the difference between P/S ratios calculated by vertical
components and by 3-component stations ?
This question is important for seismic arrays typically consisting of
sets of vertical sensors. In this case this question sounds as : Is it possible
to use vertical sensors of seismic arrays 'as is' or some correction is
neccessary ?
1.2. How should P/S ratios be measured to achieve the most reliability
of the results ?
Before making conclusions about physical nature of some events by P/S
ratio it is necessery to determine a scheme of measuring P and S amplitudes,
i.e., which parts of P and S recordings should be taken into account, is it
enough to pick maximal values of amplitudes or it is better to use average
values, which frequency ranges are more reliable etc.
1.3. What is the variability of P/S ratios measured at different sensors
for the same event ?
The following cases are studied :
a) difference in P/S ratios for the same event measured by several
vertical sensors (in some cases by several 3-component stations) of the same
seismic array (local features of the medium);
b) difference in P/S ratios for the same event measured by different
stations (difference in P and S waves attenuation, local geology, probably
radiation pattern);
1.4. What is the difference of P/S ratios for a group of seismic events
of different nature situated rather closely to each others and measured at the
same seismic station ?
The purpose is to eliminate the influence of propagation paths, in this
case the propagation paths are similar.
1.5. Is there at least a statistical difference in P/S ratios for events
of different kinds ?
To answer this questions several groups of seismic events are selected
(mining explosions, earthquakes, underwater explosions) and estimation of P/S
ratios are done for the stations where recordings are available.
2.
Method of computations.
We made a PC program PScalc for P/S ratios calculation. It enables to
input a recording (single channel or 3-component), mark manually 3 time windows
: parts of the recordings containing : i) a noice before signal; ii) a part of
recording containing P-wave iii) S-wave.
An user can specify a set of band-pass filters to be used for the
calculations. After that the signal is passed through each filter of the set.
If 3-component recording is in process, its amplitude is calculated as A=Ö(X2+Y2+Z2). To smooth the amplitudes
are replaced by STA trace (sliding average of amplitudes by several samples).
Maximal amplitudes for the windows are taken as values for noice, P-wave
and S-wave. If the option 'use noice' is on, P and S amplitudes are corrected
by noice as Acorrected=Ö(A2-Anoice2).
(In fact, this correction appeared negligible for the most part of processed
signals).
Optionaly it is possible to use average amplitudes within each time
window instead of maximal amplitudes.
These amplitudes are used for P/S ratios calculations. The results can
be plotted as P/S ratios or amplitudes versus frequencies (average band
frequency is taken) by additional program PSview. (See screenshots in fig.1).
The approach is similar to spectral analysis but gives more smooth
results.
In the study we use STA averaging by 10 samples with sampling frequency
40 Hz and the following set of bandpass filters :
|
F0,
Hz |
F1,
Hz |
|
1 |
4 |
|
1.5 |
4.5 |
|
2 |
5 |
|
2.5 |
5.5 |
|
...
etc ... |
...
etc ... |
|
11.5 |
14.5 |
|
12 |
15 |
|
12.5 |
15.5 |
|
13 |
16 |
Fig.2.1. Screenshots of the
programs PScalc and PSview.
3.
Variability of P/S ratios measured for the same events at different sensors of
the same seismic array.
Frode Ringdal noticed [??? reference] that for NORESS recordings P/S
ratios of the same seismic event vary significantly from sensor to sensor
(vertical sensors). We checked this observation using ARCESS recordings of
several events.
The first event we analysed was an underground mining explosion in
Khibiny (Kirovsky mine) : 12/10/1997, 67.667 N, 33.727 E, T0=3.37:28, distance
to ARCESS is 392 km.
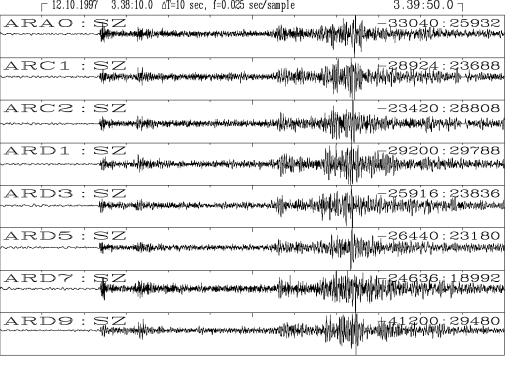
Fig. 3.1. Recordings of
underground Khibiny explosion 12/10/1997 at several vertical sensors of ARCESS.
We processed separately 23 vertical channels and 4 3-c recordings as
described in Chapter 2. The results are shown in Figure 3.2.
a) Maximal amplitudes of P and
S waves for a set of bandpass filters;
b) P/S ratios for the set of
bandpass filters and maximal amplitudes;
c) Standard deviations for
the two sets of P/S ratios;
Fig. 3.2. Results of processing of vertical ARCESS
sensors (black lines) and 3-component stations (red lines) for the explosion
12.10.1997
The resuls are in a good agreement
with the observations made by Frode Ringdal. Indeed, the ratios vary
significantly for vertical sensors, less for 3-component stations, although
difference in P/S ratios for 3-component stations for some frequency bands
amounts to 1.
As it is clearly seen in Fig.
3.2.(a), such variability in P/S ratios are mostly due to P-wave amplitudes
variability which is much greater than for S-waves, especially for 3-component
stations. (Greater variability of P-waves than S was also noticed by Frode Ringdal
in NORESS recordings)
The second event we analyzed was an earthquake under Imandra lake near
Khibiny Massif. The earthquake occured 26.06.1996, 21.32:15, coordinates are
67.67 N, 33.00 E, distance to ARCESS about 367 km.
This event is unique : perhaps the only one in North-Western Russia for witch we can completely definitely state
that it was an earthquake with a significant depth and a lengthy source,
probably displacement along a fault. Our modelling enabled us to estimate its
depth as 15-20 km (see Fig 3.3). We shall refer to the earthquake in other
chapters.
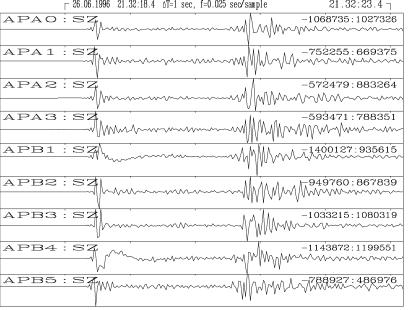
Fig 3.3. Recordings of the
26.06.1996 earthquake by vertical sensors of Apatity array (epicentral distance
about 16 km). A strong difference in recordings by closely located sensors
indicates a lengthy source.
18 vertical sensors and 2 3-component stations (ARCESS) have been
processed. The results are shown in Fig.3.4.
a) Maximal amplitudes for
set of bandpass filters;
b) P/S ratios by maximal
amplitudes;
Fig. 3.4. Results of processing of vertical ARCESS
sensors (black lines) and 3-component stations (red lines) for the Imandra
earthquake 26.06.1996
The results are similar : great difference in P/S ratios for vertical
sensors, less but significant for 3-component stations, difference in
ampitudes, especially for P-wave.
One can of course try to explain this strange phenomenon by deviations
in amplitude-frequency responses of different sensors. But this is doubtful
because the amplitude curves have different shapes and this does not explain
the difference in P/S ratios.
Our explanation is that such difference is due to the conductive medium
properties in the vicinity of the sensors (geological features and/or relief).
To check this we calculated average P/S ratios by all frequency bands for each
sensor and plotted them as points of different colors in coordinates of the
sensors. The results are shown in Fig. 3.5.
Fig. 3.5. Average P/S ratios
by vertical sensors of ARCESS for
Imandra earthquake 26.06.1996 (left) and Khibiny underground explosion
12.10.1997 (right). Red points mark sensors with higher P/S ratio. Lines
indicate azimuth to the events.
Some regularity does exist, indeed,
blue circles indicating low P/S ratios are grouped mostly on the right.
For our mind it confirms that the difference in P/S ratios is mostly due to the
local inhomogeneity of the medium.
We have no exact explanation of the phenomenon that scattering of S-wave
amplitudes is much less than for P-waves.
Our assumption is as follows : if a wave meets a surface near a sensor
it can produce a secondary wave, say P may produce S and vice versa. This waves
move with different speeds and therefore arrive to the sensor with a time
delay. The seismic energy carrying by a wave is dividing into two groups
separated in time so when we are calculating maximal amplitudes we may take
into account only one of these groups.
If the producing of secondary
waves is not symmetrical (S waves
produce less P than P produce S) it can explain the situation.
No matter is this explanation close to the truth or not it led us to the
conclusion that it is preferably not to calculate maxima of amplitudes within
time windows but use averaged values for the windows. Unlike the maxima this
approach require accurate definition of the time windows. We used for the two
events time windows for P covering the most part of Pn starting with its onset
and corresponding windows for S about 1.7 times longer (Vp/Vs).
The results (for all 3-component stations) including ratios and
amplitudes calculated by maxima, for vertical sensors and whole stations as
well as amplitudes and ratios calculated by the averaging are shown in Figures
3.6 and 3.7.
Fig. 3.6. Underground
explosion in Khibiny 12.10.1997. Comparison of P and S amplitudes calculated by
:
- maxima, vertical sensors
(blue thin lines);
- maxima, 3-component (red
thin lines);
- averaging, 3-component
(black thick lines);
a) amplitudes;
b) P/S ratios;
c) Standard deviations for P/S
ratios
Fig. 3.7. Imandra earthquake
26.06.1996. Comparison of P and S amplitudes calculated by :
- maxima, vertical sensors
(blue thin lines);
- maxima, 3-component (red
thin lines);
- averaging, 3-component
(black thick lines);
The scattering in P amplitudes as well as in P/S ratios diminished
significantly in both cases. Maximal difference in P/S ratios is about 0.3 in
first case and 0.1 in second case.
But we still did not checked the situation where the averaging is
applying to Z-components only. The figure below presents the comparison of
using the averaging for 3-component stations and vertical sensors only :
Fig. 3.8. P/S ratios and
amplitudes by averaging using vertical sensors (red lines) and 3 components
(black thick line). Khibiny explosion 12.10.1997
It is clearly seen that for the approach with averaging scattering of amplitudes is essentially greater for
vertical sensors only than for 3 components.
Finishing the chapter, we compare P/S ratios for the two considered
events using the most stable method namely average amplitudes by 3-component
stations.
Fig 3.9. P/S ratios
calculated by 3-component stations (all available 3-c data were used) for the
underground explosion 12.10.1997 (black lines) and Imandra earthquake
26.06.1996 (blue lines).
As it is seen these two events may be discriminated well in high enough
frequency bands. But note, that these
two events have very similar event-to-station paths and very different nature.
Conclusions
- single vertical sensors are completely useless for P/S ratio
estimating;
- approach with calculating average amplitudes in ‘compatible’ time
windows (under ‘compatible’ we mean starting with wave onsets and with length
of S-window about 1.7 times greater than P), in contrast to the calculation of
maxima, enables to diminish significantly the influence of local inhomogenity
on the P/S ratio estimate;
- the variability of this approach requires some more detailed
statistical study;
4. Variability of P/S ratios
in some special cases.
In previous chapter we considered P/S ratios for recordings of the same
seismic event at the same station (different sensors of a seismic array) and
worked out an approach of P/S estimation which seems to be the most reliable to
diminish the influence of local inhomogeneity of the medium.
In this chapter we shall apply the approach to several special cases to
highlight the influence of another
factors mentioned in the introduction. In general, the following cases should be considered :
- one KIND of events occured in the same place - one stations
(variations in P/S ratios within a discrimination group). Mining explosions in
Khibiny recorded at ARCESS will be considered;
- one event - different stations (influence of propagation paths);
- one KIND of events occured in different places - one station (Mining
explosions in Kola Peninsula recorded at ARCESS will be considered);
- one KIND of events - different stations;
- different kinds of events - one station;
- different kinds of events - different stations (to check how the
criterion could be applied ‘as is’, i.e., without adjusting calibrations for the mentioned factors;
Not all of the cases mentioned will be considered in the study. Some of
them will be the matter of future investigation.
4. Sets of events occured
closely to each other and recorded by the same stations.
We selected 7 Khibiny mining explosions (both open-pit and underground)
well-recorded at ARCESS.
We added the recording of mining collapse occured 16.04.1989 immediately
after an underground explosion in Kirovsky mine.
And 3 more events are strongly suspected to be rockbursts in the Khibiny
Massif within the mining area.
For comparison the earthquake 26.06.1996 (path to ARCESS is near the
same) was added.
The events are given in the table below (distances to ARCESS are 380-400
km).
|
T0 |
Mine |
Remark |
|
28.07.1996 03.14:30 |
Yukspor |
Underground,
95 ton |
|
31.07.1996 11.09:25 |
Koashva |
Open-pit,
179 ton |
|
02.08.1996 11.19:35 |
Central |
Open-pit,
113 ton |
|
02.08.1996 11:23:52 |
Central |
Open-pit |
|
16.08.1996 08.23:55 |
Koashva |
Open-pit,
94 ton |
|
29.09.1996 06.05:48 |
Kirovsky |
Underground,
350 ton |
|
12.10.1997 03.37:30 |
Kirovsky |
Underground |
|
|
|
|
|
26.10.1995 05.31:06 |
Rasvumchorr-Central |
Rockburst |
|
17.11.1993 07.45:14 |
Kirovsky |
Rockburst |
|
12.12.1993 08.50:05 |
Kirovsky-Yukspor |
Rockburst |
|
|
|
|
|
26.06.1996 21.32:15 |
67.67
N, 33.00 E |
Imandra
earthquake distance
to ARC = 367 km |
|
|
|
|
|
16.04.1989 06.34:44 |
Kirovsky |
Mining
collapse |
We computed P/S ratios by the central 3-component station of ARCESS. The
results are given in Figure 4.1.1. Note, that P/S ratios for the mining
collapse, the rockbursts and the earthquake are not included into standard
deviation (i.e., it is computed by explosions only).
Fig. 4.1.1.
P/S ratios for Khibiny
mining explosions (balck lines), the mining collapse 1989 (magenta line),
mining rockbursts (red lines) and Imandra earthquake (blue line) on top.
Standard deviation of P/S
ratios for the explosions;
It is easy to make a preliminary observation : the most part of
explosion curves (excluding the first explosion and the collapse) coincide well
in low and high frequency bands, having a significant scattering from 6 to 10
Hz. All explosions curves coincide well in high frequencies.
The curves for the mining collapse as well as for the mining rockbursts
are situated below the curves for the explosions in higher frequency
bands. The curve for Imandra earthquake
is even lower.
The second group of events comprises 3 mining explosions in Zapolyarny
(about 200 km from ARCESS) :
23.08.1996 11.11:30
23.08.1996 11.13:56
28.08.1996 11.23:37
Fig 4.1.2. P/S ratios for 3
Zapolyarny explosions recorded by ARCESS and their standard deviation.
Although all 3 curves are similar there is a great difference if to
compare with the curves for Khibiny events. How to explain the difference (by
difference in the sources character or by different path-to-station influence
or by some combination of the factors) is the matter for future study.
4.2. Recordings of events of similar types (but occured in
different places) for the same station.
Mining explosions in Kola
Peninsula and Kareliya recorded at ARCESS are considered. In addition to the
Khibiny mining explosions mentioned above the explosions in Kostomuksha,
Olenegorsk and Zapolyarny (the 3 explosions mentioned above) has been
processed.
Extra explosions :
|
DATE |
TIME |
COORD |
DIST
TO ARC |
REMARK |
|
22.08.1996 |
08.24:42 |
68.048
N 33.145 E |
349
km |
Olenegorsk |
|
28.08.1996 |
09.49:02 |
64.697
N 30.689 E |
582
km |
Kostomuksha |
The figure with the results (excluding two mostly deviant Khibiny
explosions curves) is given below. For comparison Imandra earthquake 26.06.1996
was added.
Fig. 4.2.1. Mining
explosions in Kola Peninsula recorded by ARCESS plus Imandra earhquake (top)
and standard deviation of P/S ratios for all the explosions (bottom).
The significant difference between the groups of curves are seen. Is it
due to the influence of propagation paths or difference in physical nature
of the explosions (in the exploding
technology) should be studied in future.
4.3. Recordings of the same
event at different stations.
Below we present results of processing of several seismic events, both
earthquakes and explosions, each one by all stations which data we have.
The first is event of unknown nature occured 16.08.1997 in Kara Sea near
Novaya Zemlya : 16.08.1997 2.11:00,
72.47 N 57.76 E.
Fig 4.3.1. Event 16.08.1997 in Kara Sea
Unfortunately data by NRI and
KEV had digitizing frequency 20 Hz and were computed in half of the frequency
bands. Stations KBS and SPI are closely to each other. Nevertheless, for far
stations KEV, KBS and SPI the curves
are closely to each other both in lower and higher frequency bands (just the
same was observed for Khibiny explosions) and differ in the middle.
Significant difference between these curves and the Amderma curve
probably demonstrates a dependence of P/S ratio from distance.
Next we considered the mentioned above calibration underground explosion
in Kirovsky mine in Khibiny (29.09.1996
06.05:48). It was recorded by many seismic stations, we selected the
recordings with high signal-to-noise ratio, including recordings at temporary
station PLQ which was installed specially to register the explosion.
Fig 4.3.2. Calibration
underground explosion in Khibiny
In this case results are variable and do not show any clear dependence
of P/S ratio on distance.
An extremely interesting event for our study is the earthquake occured
21.01.1996, 2.16:34 in Northern Norway (69.156 N, 24.516 E). By some estimates
its depth was about 10-20 km. The results of its processing are shown in Figure
4.3.3
Fig 4.3.3. Earthquake in
Northern Norway, 21.01.1996.
The results can be easy divided onto two groups of curves with very
similar shapes, each one containing both far and near stations : 1) AMD (1425
km) and KEV (118 km) and 2) KBS (1144
km), LVZ (435 km) and AP0 (387 km).
The only explanation we can give is that it is due to non-symmetrical
source, i.e., different radiation patterns. The geometry of the source and
stations is shown in Figure 4.3.4.
Fig. 4.3.4. Location of the
21.01.1996 earthquake and directions to the stations.
Indeed, athimuths to stations KEV and AMD are close, same as to LVZ and AP0 and azimuth to KBS is almost opposite to AP0.
The situation is very similar for the Imandra earthquake mentioned
several times above (26.06.1996, 21.32:15,
67.67 N, 33.00 E). The results
for stations LVZ and AP0 (curves of the same shape) and ARC, as well as the map
of the event and azimuth are given in Figure 4.3.5.
Fig. 4.3.5. P/S ratios
for Imandra earthquake 26.06.1996 and
configuration of the event and stations;
DISCUSSION AND CONCLUSIONS
1. P/S ratios calculated by vertical sensors recordings and/or maximal P
and S amplitudes are extremely variable due to the medium properties in the
vicinity of sensors. Such variability can be significantly diminished by using
3-component recordings and average P and S amplitudes for compatible time
windows.
2. Frequency patterns of P/S ratios of events of the same type recorded
by the same station seem to be close to each other (example of Khibiny
explosions recorded at ARCESS) whereas seismic events of other types (the
mining collapse, rockbursts and Imandra earthquake) occured about in the same place differ from
explosions, especially in higher frequency bands.
The observed difference was regular : Khibiny explosions have higher P/S
ratios, less for rockbursts and even more less for the Imandra earhquake.
3. P/S ratios for events of similar types occured in differnt places
(examle of mining explosions at Kola Peninsula) and recorded by different
stations have a great scattering. Possible reasons are : influence of
propagation paths; different exploding technologies. This requires additional
study.
4. The great scattering of P/S ratios was observed for the case ‘one
event - many stations’. For 2 earthquakes the scattering can be clearly
separated onto two parts : a) due to non-symmetrical radiation patterns of
their sources; b) dependence on distance.
The following preliminary
conclusions can be done :
1. It seems quite impossible to use P/S ratio for events discrimination
‘as is’, i.e., by recordings of a single station without preliminary
calibration.
2. Even after preliminary calibration the possibility of use P/S ratio
is doubtful for a single station because some non-symmetrical sources can be
wrongly discriminated due to their radiation patterns influence.
3. It may appear to be possible to use P/S ratios for some predefined
set of seismic stations for the discrimination of events within a predefined
region after carefull calibration, i.e., taking into account all the factors
mentioned above
APPENDIX
Seismic stations and seismic
events used in the study
Table A1. Seismic stations
|
Name |
Coordinates |
Remark |
|
ARC |
69.5349
N 25.5058 E |
ARCESS,
array |
|
AP0 |
67.6033
N 32.9944 E |
Apatity,
array |
|
AMD |
69.7440
N 61.6480 E |
Amderma,
micro-array |
|
LVZ |
67.8979
N 34.6514 E |
Lovozero,
3-C |
|
NRI |
69.4000
N 88.1000 E |
Norilsk,
3-C |
|
KBS |
78.9180
N 11.9240 E |
Spitsbergen,
3-C |
|
SPI |
78.1777
N 16.3700 E |
Spitsbergen,
array |
|
KEV |
69.7550
N 27.0070 E |
3-C |
|
PLQ |
66.4100
N 32.7500 E |
Temporary
3-C station |
Fig. A1. Map of seismic stations used in the study.
Table A2. Seismic events
|
Date |
T0 |
Coordinates |
Remark |
|
16.04.1989 |
06.34:44 |
|
Mining
collapse, Kirovsky |
|
17.11.1993 |
07.45:14 |
|
Kirovsky,
rockburst |
|
12.12.1993 |
08.50:05 |
|
Kirovsky-Yukspor, rockburst |
|
26.10.1995 |
05.31:06 |
|
Rasvumchorr-Central, rockburst |
|
21.01.1996 |
2.16:34 |
69.156
N, 24.516 E |
Northern
Norway |
|
26.06.1996 |
21.32:15 |
67.67
N, 33.00 E |
Imandra
earthquake distance
to ARC = 367 km |
|
22.08.1996 |
08.24:42 |
68.048
N 33.145 E |
Olenegorsk |
|
23.08.1996 |
11.11:30 |
|
Zapolyarny |
|
23.08.1996 |
11.13:56 |
|
Zapolyarny |
|
28.08.1996 |
09.49:02 |
64.697
N 30.689 E |
Kostomuksha |
|
28.08.1996 |
11.23:37 |
|
Zapolyarny |
|
16.08.1997 |
2.11:00 |
72.47
N 57.76 E |
Kara
Sea |
|
12.10.1997 |
03.37:28 |
67.667
N, 33.727 E |
Underground
calibration Khibiny Kirovsky |
|
|
|
|
|
|
|
|
|
|
|
|
|
|
|
|
|
|
|
|